GO PPROF 协程泄漏分析
代码模拟一个协程泄漏
package main

import (
    "fmt"
    "net/http"
    _ "net/http/pprof"
    "os"
    "runtime"
    "runtime/trace"
    "time"
)

func main() {
    f, err := os.Create("trace.out")
    if err != nil {
        panic(err)
    }
    defer f.Close()
    err = trace.Start(f)
    if err != nil {
        panic(err)
    }
    defer trace.Stop()
    runtime.GOMAXPROCS(1)
    runtime.SetMutexProfileFraction(1)
    runtime.SetBlockProfileRate(1)
    registerProf2()
    Goroutine{}.makeG()
}

func registerProf2() {
    port := ":8060"
    go func() {
        err := http.ListenAndServe(port, nil)
        if err != nil {
            panic("pprof start error" + err.Error())
        }
    }()
}

type Goroutine struct {
}

func (g Goroutine) makeG() {
    for {
        time.Sleep(1 * time.Second)
        go func() {
            fmt.Println("make go")
            time.Sleep(10 * time.Second)
            fmt.Println("end go")
        }()
    }
}
使用pprof分析协程信息
go tool pprof -http=:8080 http://localhost:8060/debug/pprof/goroutine
从火焰图或者graph上看协程阻塞原因,使用top查看协程对多的函数
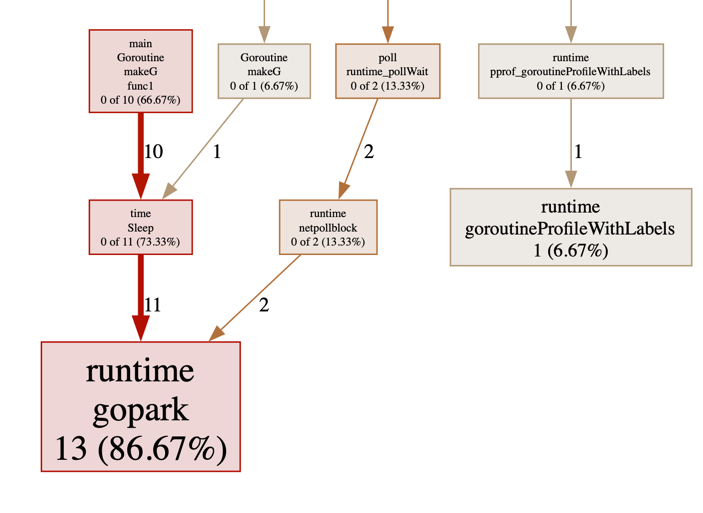
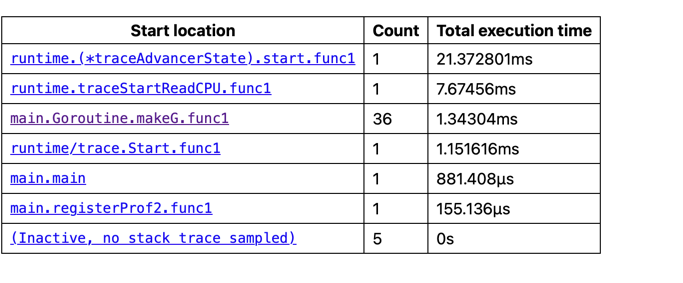
使用trace 工具工具
go tool trace trace.out
可以看到协程阻塞的位置
协程泄漏原因
以下是定位和解决 Go 协程泄漏(Goroutine Leak)问题的系统性方法和工具指南:
一、协程泄漏的常见原因
| 场景 | 示例 |
|---|---|
| 阻塞的 Channel 操作 | 协程因等待未关闭或未发送的 Channel 而永久挂起 |
| 死循环未设退出条件 | for {} 或 select {} 缺少终止逻辑 |
| 未正确使用 Context 超时 | 未设置 context.WithTimeout 导致协程无法被取消 |
| 同步原语误用 | sync.WaitGroup 的 Add 与 Done 不匹配,或 Mutex 未释放 |
| 第三方库/框架未释放资源 | HTTP 长连接、数据库连接池未关闭 |